PulseView features you might have missed
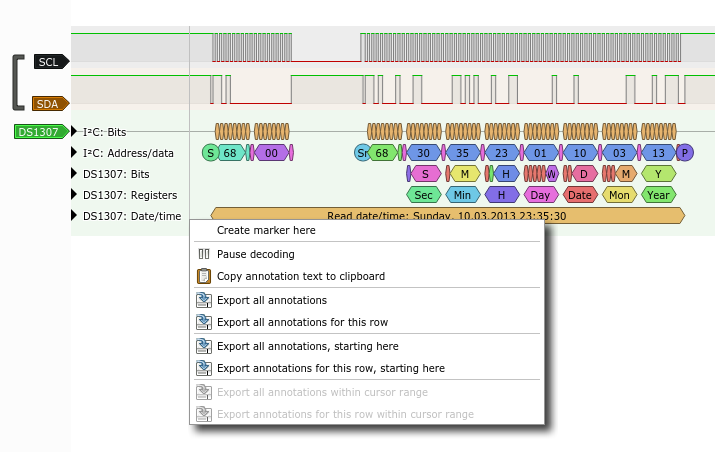
 Users of the nightly PulseView builds may have noticed a while ago but we haven't publicly documented it up until now: decode traces now have a context menu that you can access by right-clicking on a decoder trace.
The most prominent feature here is to export annotations to a text file and this is what I want to highlight in this post. With this feature, you can export annotations and post-process them, allowing you to use the data in whatever way you need. Aside from the obvious choices presented to you by the context menu, you can customize the output in the settings dialog using a format string:
 The default format string probably contains more than you need, so feel free to adjust it to your liking. For example, the string "%s %d: %1" will generate the following output for the example above: "253-471 DS1307: Read date/time: Sunday, 10.03.2013 23:35:30"
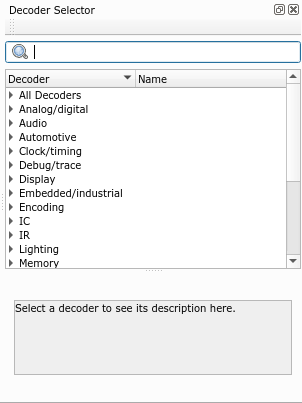
Unannounced until now as well was the new protocol decoder selection subwindow. Clicking on the "Add Decoder" button or simply pressing its hotkey 'd' will now get you this:
 From there, you can either start typing away to apply a filter or browse through the available protocol decoders. Do note that in contrast to the previous menu that you were shown, you now see all protocol decoders - both stacked and unstacked. If you choose to add a stacked one, PulseView will try to figure out which stacked decoder you need. In case it's ambiguous, it'll ask you which one you want to use.
In case you already know what you want, you can simply press 'd', type the name of the protocol decoder, press enter and when followed up by the escape key, the selection subwindow will close again. Then, you'll have added the decoder of your choice without having to click even once.
We hope you find these features useful and as always: if there's something you find amiss or that doesn't work the way you expect, please file a bug in the bug tracker so we can talk about it: https://sigrok.org/bugzilla.
- Sören Apel's blog
- 8122 reads
