Error message

  • Warning: count(): Parameter must be an array or an object that implements Countable in theme_table() (line 1998 of /data/sigrok.org/apache/blog/includes/theme.inc).
  • Warning: count(): Parameter must be an array or an object that implements Countable in theme_table() (line 2061 of /data/sigrok.org/apache/blog/includes/theme.inc).
  • Deprecated function: implode(): Passing glue string after array is deprecated. Swap the parameters in drupal_get_feeds() (line 394 of /data/sigrok.org/apache/blog/includes/common.inc).
  • Deprecated function: The each() function is deprecated. This message will be suppressed on further calls in menu_set_active_trail() (line 2405 of /data/sigrok.org/apache/blog/includes/menu.inc).

Sören Apel's blog

New in PV: Tabular Decoder Output View

A while ago we added a feature that has been requested often in the past: a way to view decoder output in list form. This is now implemented and generally working, so try it out by clicking on the small arrow next to the "New View" toolbar icon!

It's still in its infancy, with more features to come, but the important things are working:

  • You can hide or re-arrange the colums by left-/right-clicking the table header
  • You can save the output of the table to disk
  • You can choose to see all annotations or only those which you also see in the main trace view - meaning hidden annotations will also be hidden in the table

Also, hovering over the annotations in the main trace view will highlight the corresponding annotations in the table and double-clicking (or pressing Enter on) an annotation in the table will focus on that particular annotation in the main trace view.

In the future, you'll be able to add additional filters to the table (e.g. showing only annotations where "value >= 40") and searching will be possible, too.

As always, if you have features you find amiss or you discover bugs that you want to see fixed, let us know!

New protocol decoder: xy2-100

libsigrokdecode now supports yet another protocol decoder: xy2-100.
 

This is a protocol used to communicate with laser scanner galvanometers, used for laser shows, laser engravers and similar applications.


Some example traces are available in the sigrok-dumps repo but we'd love to have some where we can verify proper operation of the enhanced mode (i.e. where command/parameter pairs are sent). The status/feedback signal also has only pretty basic decoding for now, so if you have dumps where the status/feedback signal is included, please let us know!

The decoder was initially written by Uli Huber, thanks a lot!

Even more PulseView features you might have missed

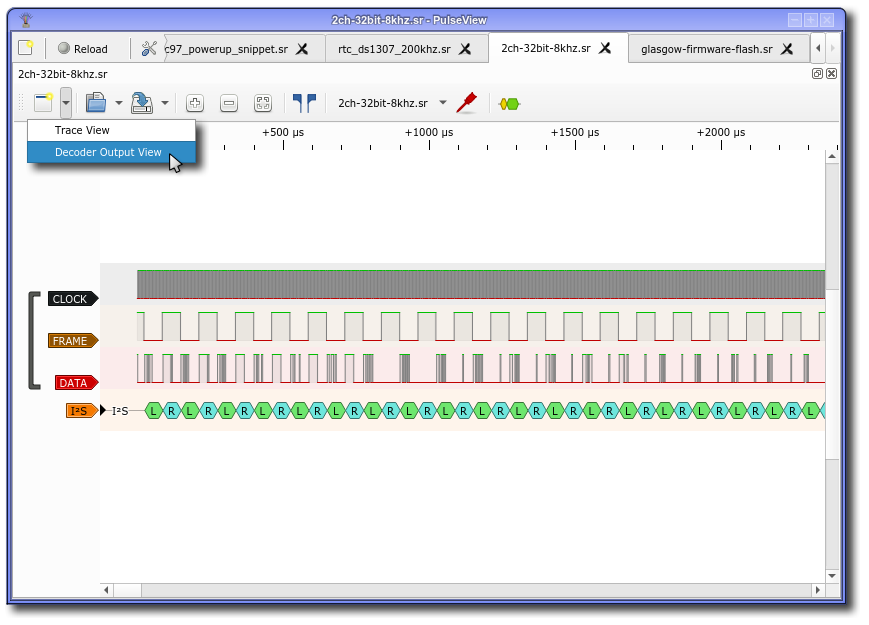
In this last installment of the "features you should know about" series of posts before the upcoming PulseView release, we'd like to first show you the current state of our decoder output view. As you may have guessed from the name, it's a new type of view and with that it can be created using the "create new view" button which you can find on the left of the toolbar.

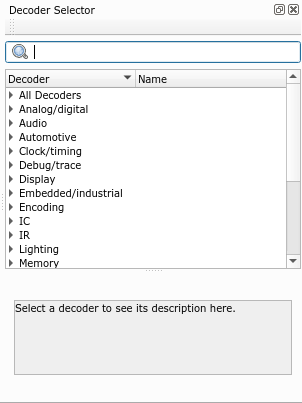
Once opened, you need to select a decoder for it to show anything. Not any decoder will do, however, it has to be a decoder that emits binary data - for example I2C, I2S, EEPROM24xx, SPI or UART. Having acquired some I2S data and using the I2S protocol decoder lets you have the sound data as raw .wav file data, for example:

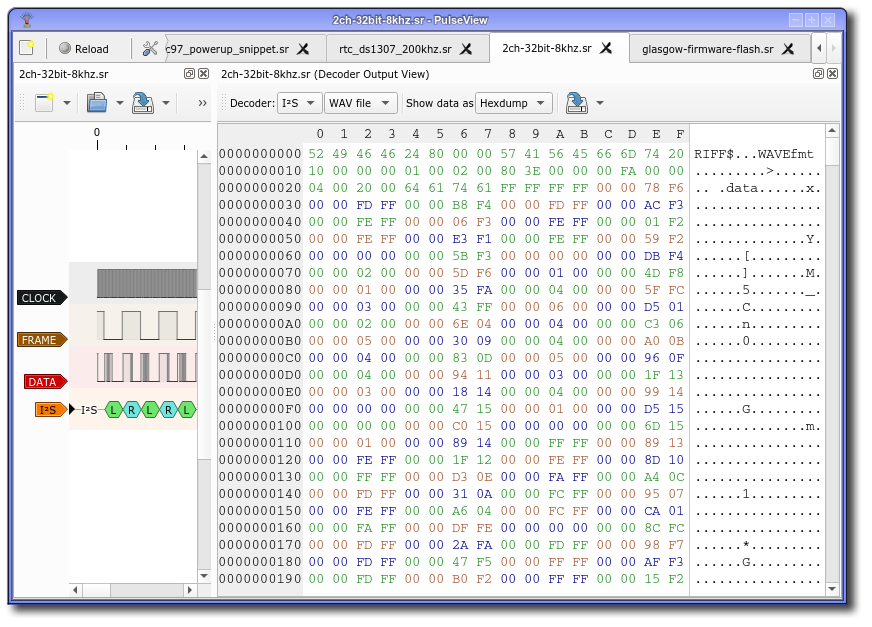
Using the save icon at the top then lets you save this data either as a binary file (in this case creating a valid .wav file) or various types of hex dumps. If you want to only save a certain part of the binary data, simply select that part before saving.

You may have noticed that the bytes are grouped by color somehow. The meaning behind this is that every chunk of bytes emitted by the protocol decoder receives one color, the next chunk another color and so on. As there are currently three colors, the cycle repeats. This makes it easier to visually organize the data that you see - in the case of the I2S decoder, the header has one color because it's sent out in one go and following that, every sample for left/right consists of 4 bytes with the same color since they're sent out one by one.

In the future, we'll use this view to let you do more things. For example, it would be useful to reconstruct EEPROM contents from observing the wire and so that's just what we'll allow you to do. Also, we're going to support MIME types so that protocol decoders can describe the binary data they're sending out. In the case of I2S, this will allow PulseView to offer media playback directly and in the case of LCD display decoders will allow you to immediately see what the display would show.


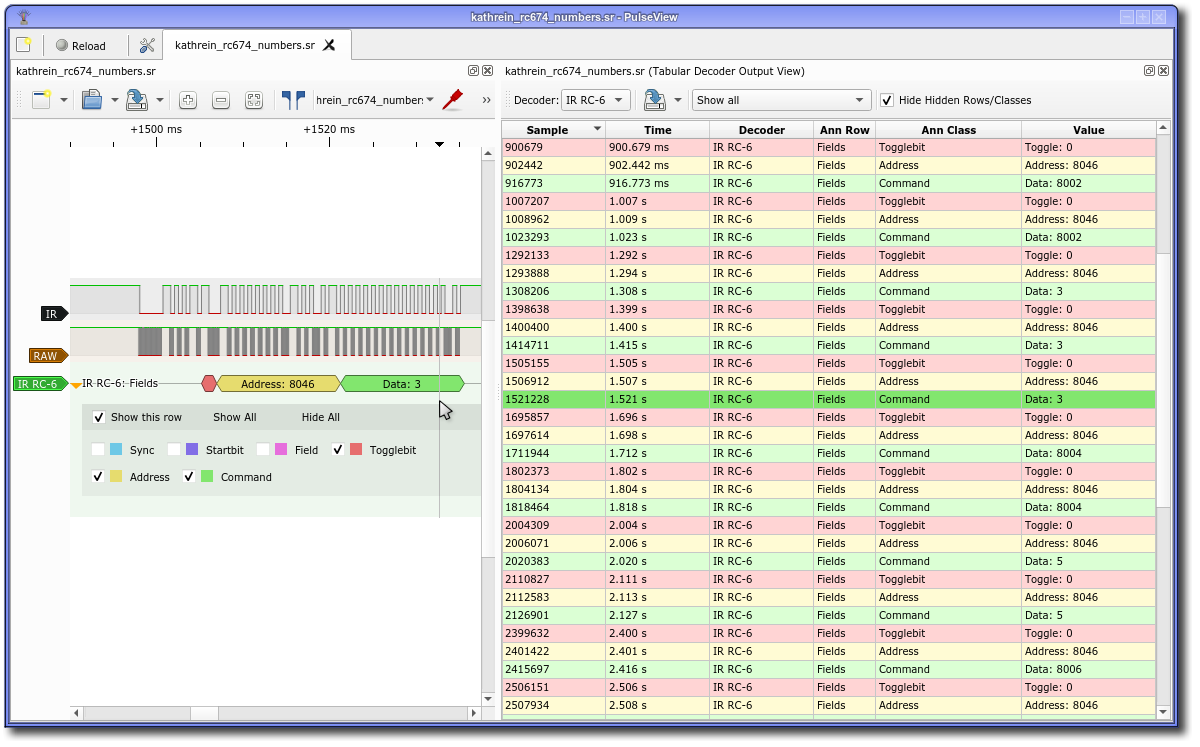
Last but not least, we'd like to point out that you now can show and hide not only individual protocol decoder rows but also the annotation classes that are assigned to them. To do so, simply click on the arrow or label of the row you want to customize.

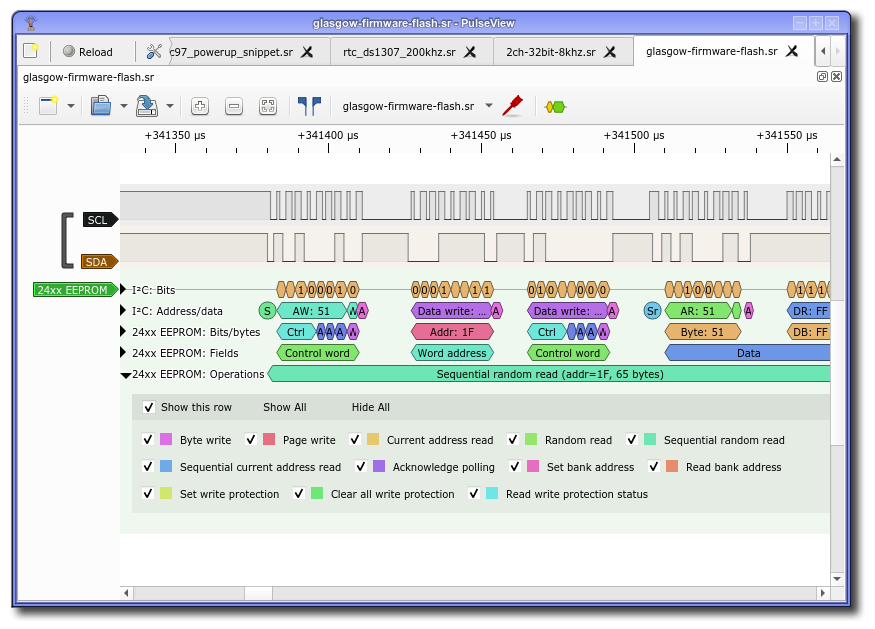
From that menu, you can either show/hide the entire row or choose the annotation classes you want to see. Everything is visible by default but if you want to focus on specific protocol messages or status annotations like warnings or errors, this should help. Also, if you are examining really long traces, disabling annotations for the most-often occuring type (e.g. bit annotations for SPI) then drawing performance will increase, too.

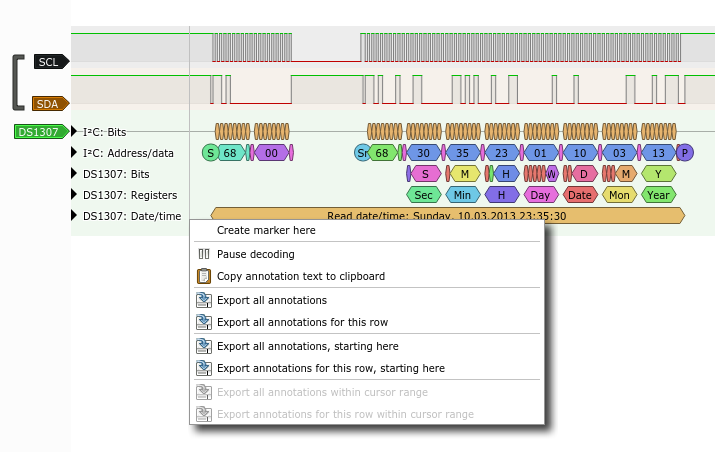
In the future, we'll also let you do more things from there, like exporting annotations. If there's something else you'd like to see available from there, let us know!


More PulseView features you might have missed

Just like in the previous blog post, we would like to make you aware of features that you may not have known about yet. The first one seems kind of minor but may not be so minor to people that don't speak English - translations. Currently, only German is supported (because we're German, duh) and so we'd appreciate if you'd supply translation files for other languages that we can include. Please check https://sigrok.org/wiki/PulseView#Translations for instructions on how to do that.

Next up we have some additional marker functions that were supplied by Martin Miklos. He added an auto-delta feature that shows you the time difference to all other timer markers when you hover over one:


Also, he added quick-access hotkeys for the left and right cursor boundaries which we have attached to the keys '1' and '2', respectively. This means that instead of having to re-arrange the cursor boundaries right after enabling it, you may now simply press '1' and have the left side of the cursor follow your mouse. Clicking or pressing escape puts it down. Then, you may do the same with the other side by pressing '2'. This should make using the cursor much faster.

In the spirit of efficiency, we also elimiated the need to enable the cursor altogether. Simply press '1' or '2' and the cursor will be enabled automatically with the left or right boundary following your mouse.

We appreciate his and all other contributions, so if you have something you'd like to implement, swing by our IRC channel to discuss and we'll help you make most efficient use of your skills when contributing :)
 

PulseView features you might have missed

Users of the nightly PulseView builds may have noticed a while ago but we haven't publicly documented it up until now: decode traces now have a context menu that you can access by right-clicking on a decoder trace.

The most prominent feature here is to export annotations to a text file and this is what I want to highlight in this post. With this feature, you can export annotations and post-process them, allowing you to use the data in whatever way you need. Aside from the obvious choices presented to you by the context menu, you can customize the output in the settings dialog using a format string:

The default format string probably contains more than you need, so feel free to adjust it to your liking. For example, the string "%s %d: %1" will generate the following output for the example above: "253-471 DS1307: Read date/time: Sunday, 10.03.2013 23:35:30"
 

Unannounced until now as well was the new protocol decoder selection subwindow. Clicking on the "Add Decoder" button or simply pressing its hotkey 'd' will now get you this:

From there, you can either start typing away to apply a filter or browse through the available protocol decoders. Do note that in contrast to the previous menu that you were shown, you now see all protocol decoders - both stacked and unstacked. If you choose to add a stacked one, PulseView will try to figure out which stacked decoder you need. In case it's ambiguous, it'll ask you which one you want to use.

In case you already know what you want, you can simply press 'd', type the name of the protocol decoder, press enter and when followed up by the escape key, the selection subwindow will close again. Then, you'll have added the decoder of your choice without having to click even once.


We hope you find these features useful and as always: if there's something you find amiss or that doesn't work the way you expect, please file a bug in the bug tracker so we can talk about it: https://sigrok.org/bugzilla.
 

Subscribe to RSS - Sören Apel's blog